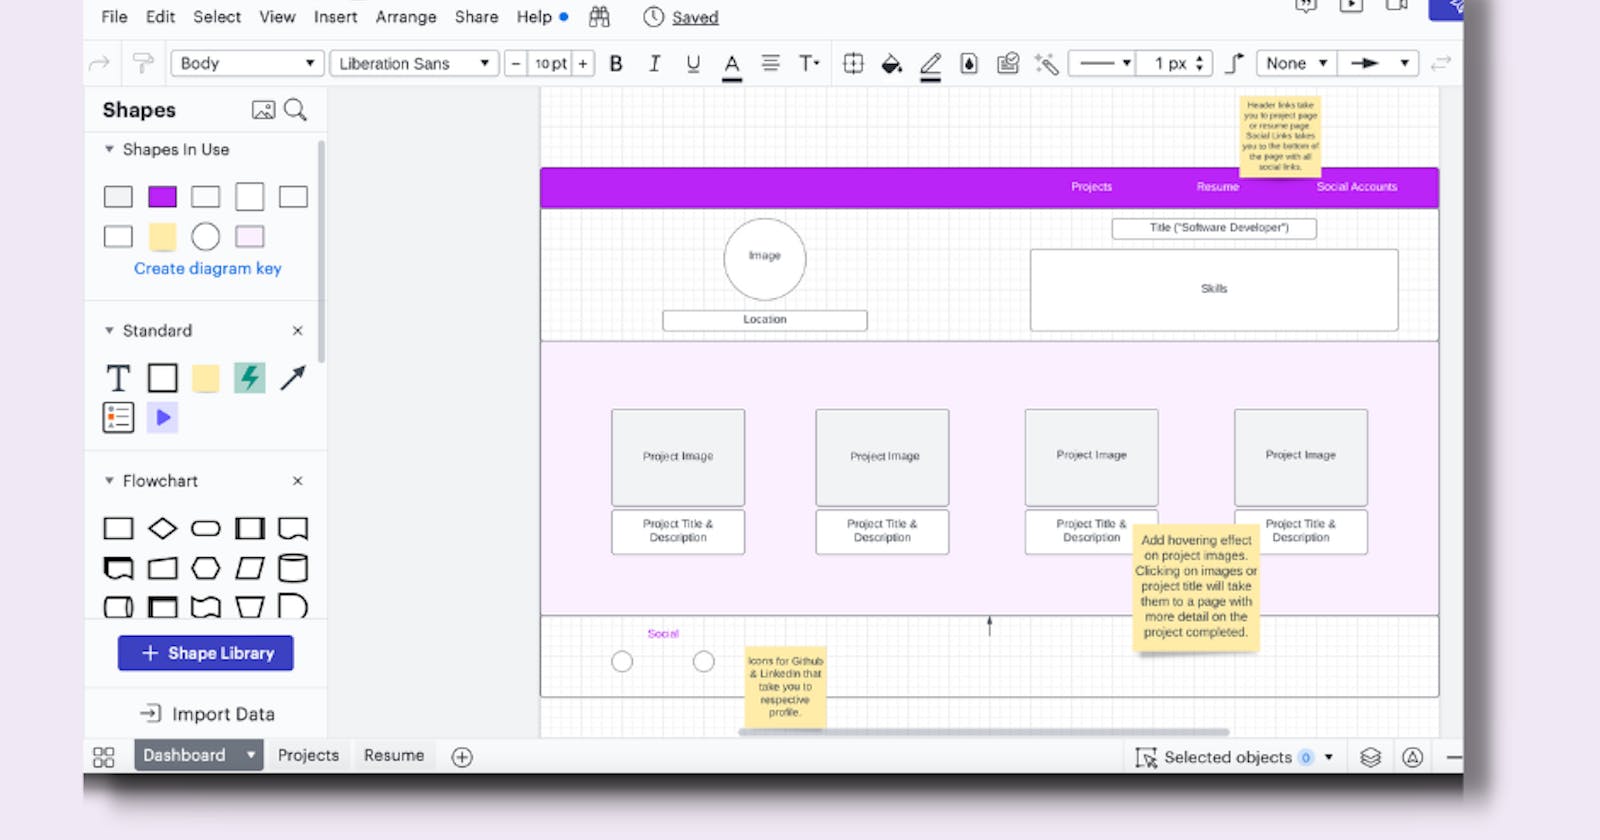


As I work on my projects, I am wanting to test different wireframe sites. This is the first one I have used and so far I am enjoying it. There is a limit of free shapes you can use with the free period which was easily maxed since I am using more than one page in my project.
It was a month ago that I created the wireframe shown here and I will admit it took me longer than I hoped to build a simple wireframe (about 2 days, 3 hours each day). However, it was my first time and I was working on not only the design but knowing where items were and how to use them.
The sticky notes are amazing as I can put any interaction or any notes I need to guide myself with as I build my site.
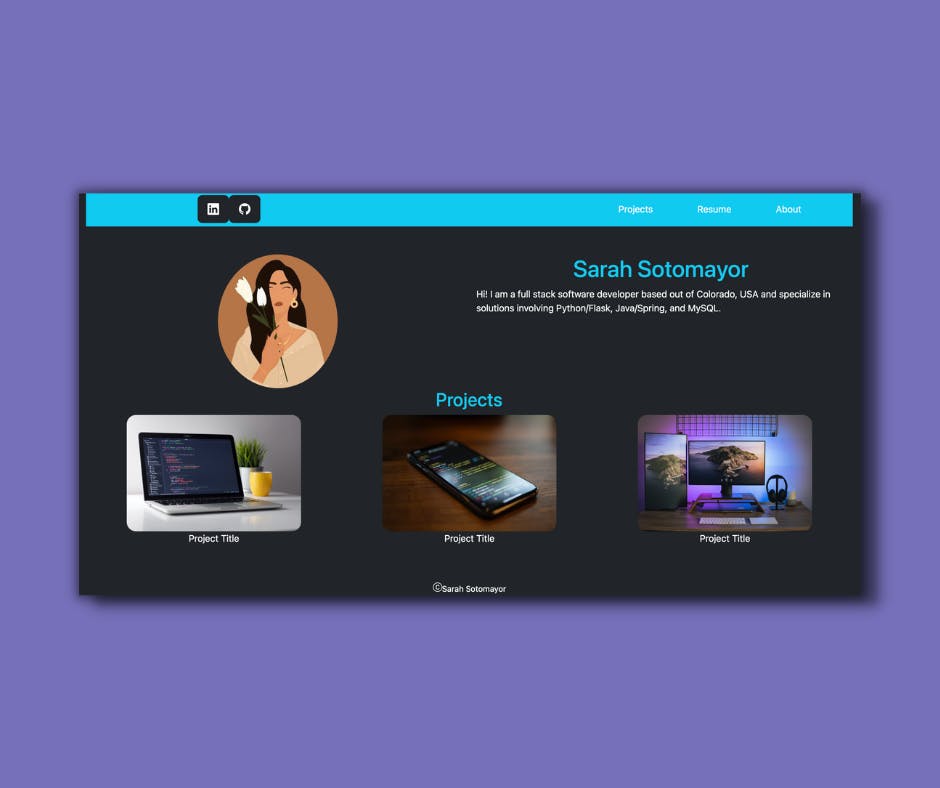
In the development process, I have made some changes. Currently, my portfolio is still unfinished as I am working on perfecting some of the styling as well as learning how to add customization to Bootstrap.
Originally I had a white background as shown in the wireframe and decided to go darker as I gained confidence in the fact that dark is okay in a portfolio (from seeing fellow devs use black). Now, I intend to use a gradient going from a nice dark color to black. That is where the customization comes in. Bootstrap only offers a set of colors that come with the default settings and to access the other colors it provides (or your own) then it needs to involve its Saas packages which is something I do not yet know how to do. So below is the current state of my build and I hope to share the completed version soon with my actual project photos and project information!
Tech used: Python/Flask/HTML/Bootstrap